Mapping sensors and data with OpenLayers 3
In the Tutorial/ol-examples folder you can find some examples using OpenLayers 3 (http://openlayers.org/).
Copy the code in your istsos installation folder by executing:
sudo cp -r ~/Desktop/Tutorial/ol-examples /usr/share/istsos/interface/modules/ol-examples
- Example 1A simple OpenLayer 3 example with an OpenStreetMap basemap and a GeoJSON Vector overlay showing sensor’s position.
- Example 3Example 2 + Mouse click interaction displaying sensor’s metadata
- Example 4Example 3 + Chart plot of last week of data
Practice with OpenLayers 3
If you want make some practice, we have prepared a file from which to begin to do some practice, let’s go to:
http://localhost/istsos/modules/ol-examples/practice.html
Open the file practice.html so we can start..
If installed from source
sudo gedit /usr/local/istsos/interface/modules/ol-examples/practice.html
If installed from debian package
sudo gedit /usr/share/istsos/interface/modules/ol-examples/practice.html
Here an overview of the file that we have prepared. A simple OpenLayer 3 example with a OpenStreetMap basemap.
<!DOCTYPE html>
<html>
    <head>
    <link rel="stylesheet" href="ol/ol.css" type="text/css">
    <script src="ol/ol-debug.js"></script>
    <style>
      #map {
        width: 600px;
        height: 400px;
      }
    </style>
    </head>
    <body>
        <div id="map" class="map"></div>
        <script>
          var map = new ol.Map({
            layers: [
              new ol.layer.Tile({
                source: new ol.source.OSM()
              })
            ],
            target: 'map',
            view: new ol.View({
              center: [1614350, 6168773],
              zoom: 5
            })
          });
        </script>
    </body>
</html>
Loading istSOS sensors on the map
The istSOS WA REST exposes a request to retrieve a GeoJSON file including all the sensors offered by a istSOS instance.
Note
To add the istSOS layer is quite simple. You have to create a Vector Layer with a Vector Source. And the source have to be configured defining the format (as GeoJSON) and the url (from where to download the GeoJSON data)
1 2 3 4 5 6 7 8 9 10 11 12 13 14 15 16 17 18 | var map = new ol.Map({
layers: [
new ol.layer.Tile({
source: new ol.source.OSM()
}),
new ol.layer.Vector({
source: new ol.source.Vector({
format: new ol.format.GeoJSON(),
url: '../../wa/istsos/services/demo/procedures/operations/geojson?epsg=4326'
})
})
],
target: 'map',
view: new ol.View({
center: [1614350, 6168773],
zoom: 5
})
});
|
Changing the istSOS vector layer style
Modify code as shown in the next box, defining a custom style:
1 2 3 4 5 6 7 8 9 10 11 12 13 14 15 16 17 18 19 20 21 22 23 24 25 | var map = new ol.Map({
layers: [
new ol.layer.Tile({
source: new ol.source.OSM()
}),
new ol.layer.Vector({
source: new ol.source.Vector({
format: new ol.format.GeoJSON(),
url: '../../wa/istsos/services/demo/procedures/operations/geojson?epsg=4326'
}),
style: [new ol.style.Style({
image: new ol.style.Circle({
radius: 5,
fill: new ol.style.Fill({color: 'green'}),
stroke: new ol.style.Stroke({color: 'red', width: 1})
})
})]
})
],
target: 'map',
view: new ol.View({
center: [1614350, 6168773],
zoom: 5
})
});
|
Reload (F5) the web page on the browser
Adding interaction to the map to display sensor metadata
Append after the map initialization this code to enable the “ol.interaction.Select” feature:
1 2 3 4 5 6 7 8 9 10 11 12 13 14 15 16 17 18 19 20 21 22 23 24 25 26 27 28 29 30 | var map = new ol.Map({
// {...}
});
// {...}
// select interaction working on "singleclick"
var select = new ol.interaction.Select({multi: true});
// Add the interaction to the map
map.addInteraction(select);
// Listen for select event
select.on('select', function(e) {
var selected = e.selected,
html = '';
for (var c = 0, l = selected.length;c<l;c++){
var feature = selected[c];
html += feature.getProperties().name + "<br/><br/>" +
"Begin: " + feature.getProperties().samplingTime.beginposition + "<br/>" +
"End: " + feature.getProperties().samplingTime.endposition + "<br/><br/>" +
"Observed properties:<br/>" ;
html += "<ol>";
var op = feature.getProperties().observedproperties;
for (var cnt = 0; cnt < op.length; cnt++){
html += "<li>" + op[cnt].name + "</li>";
}
html += "</ol><hr/>";
}
document.getElementById('details').innerHTML = html;
});
|
Reload (F5) the web page on the browser and click on a point displayed on the map. Sensor details will be displayed in the details div.
Note
If you want to display other properties using the feature.getProperties() function, this are the attributes that can be accessed:
{
    "samplingTime": {
        "beginposition": "2007-01-01T00:00:00+0100",
        "endposition": "2011-12-31T23:50:00+0100"
    },
    "sensortype": "insitu-fixed-point",
    "observedproperties": [
        {
            "name": "water-height",
            "uom": "m"
        }
    ],
    "description": "",
    "name": "A_AETCAN_AIR",
    "assignedid": "8c4b9c18d464493568cfb18d015bbed5",
    "offerings": [
        "temporary"
    ],
    "id": 51
}
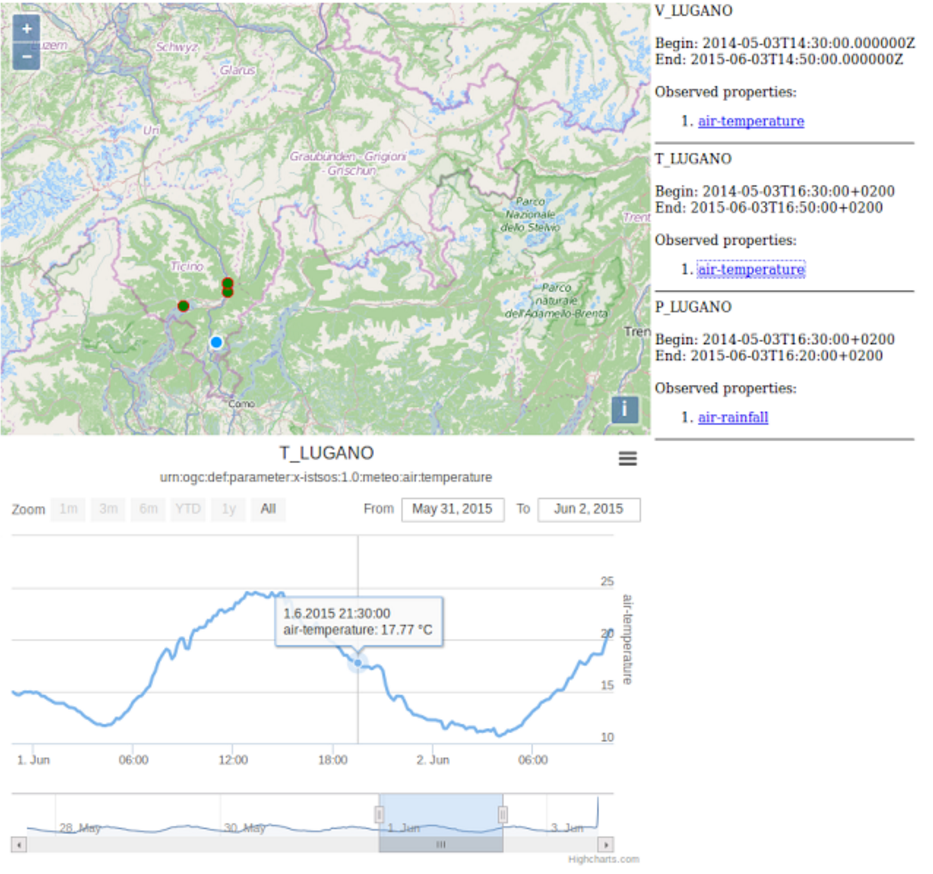
Plotting measures in a chart
The example-4.html (http://localhost/istsos/modules/ol-examples/example-4.html) is a little bit more for advanced user. Take a look a the code, here you can see how to plot observation measurements with the support of some well known JavaScript library: JQuery with MIT license (https://jquery.com) and Highcharts with a non-commercial license (http://www.highcharts.com).
Warning
Highcharts is one of the prettiest interactive charts on the web, unfortunately the licence is not from the FOSS family. But you can use the software for free under the non-commercial license.
More info on non-commercial licensing can be found here: http://shop.highsoft.com/faq/non-commercial#what-is-non-commercial
1 2 3 4 5 6 7 8 9 10 11 12 13 14 15 16 17 18 19 20 21 22 23 24 25 26 27 28 29 30 31 32 33 34 35 36 37 38 39 40 41 42 43 44 45 46 47 48 49 50 51 52 53 54 55 56 57 58 59 60 61 62 63 64 65 66 67 68 69 70 71 72 73 74 75 76 77 78 79 80 81 82 83 | // select interaction working on "singleclick"
var select = new ol.interaction.Select({multi: true});
// Add the interaction to the map
map.addInteraction(select);
// Listen for select event
select.on('select', function(e) {
var selected = e.selected,
html = '';
for (var c = 0, l = selected.length;c<l;c++){
var feature = selected[c];
var name = feature.getProperties().name;
var begin = feature.getProperties().samplingTime.beginposition;
var end = feature.getProperties().samplingTime.endposition;
html += name + "<br/><br/>" +
"Begin: " + begin + "<br/>" +
"End: " + end + "<br/><br/>" +
"Observed properties:<br/>" ;
html += "<ol>";
var from = new Date(end);
begin = new Date(end);
begin.setDate(from.getDate() - 7);
var op = feature.getProperties().observedproperties;
for (var cnt = 0; cnt < op.length; cnt++){
html += "<li><a href='javascript:chart(\""+name+"\",\""+begin.toISOString()+"\",\""+end+"\",\""+op[cnt].def+"\");'>" + op[cnt].name + "</a></li>";
}
html += "</ol><hr/>";
}
document.getElementById('details').innerHTML = html;
});
function chart(name, begin, end, observedProperty){
$.getJSON('../../wa/istsos/services/demo/operations/getobservation/offerings/temporary/procedures/'+name+'/observedproperties/'+observedProperty+'/eventtime/'+begin+'/'+end, function(json) {
var sosData = json.data[0].result.DataArray.values;
var field = json.data[0].result.DataArray.field[1];
var data = [];
for(var c = 0, l = sosData.length; c<l; c++){
var date = new Date(sosData[c][0]);
data.push([+date,parseFloat(sosData[c][1])]);
}
console.log(data);
$('#chart').empty();
$('#chart').highcharts('StockChart',{
rangeSelector : {
selected : 1
},
title: {
text : name
},
subtitle: {
text: field.definition
},
yAxis: {
title: {
text: field.name
}
},
tooltip: {
valueDecimals: 2,
formatter: function() {
var date = new Date(this.x);
return date.toLocaleString() + "<br/>" +
field.name + ": " +
this.y + ' ' + field.uom;
}
},
series: [{
name: field.name,
data: data,
labels: {
formatter: function () {
return this.value + " - stic";
}
}
}]
});
});
}
|