Get observations
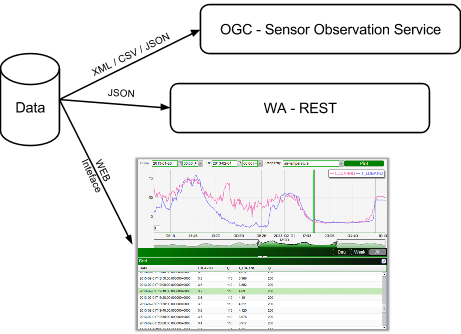
Accessing the data is possible using: * the SOS Standard requests, * WA REST requests or * directly using the Data Viewer or Data Editor.
Using the SOS Standard requests
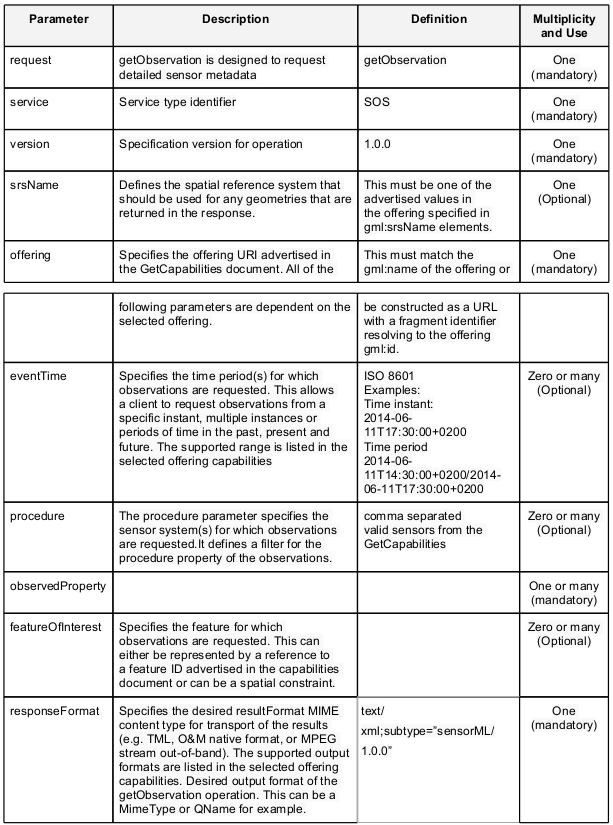
This is a quick view on the GetObservation request parameters using the GET method:
And here some example of reuests:
Example 1 - filter on procedure, time, property
Requesting rainfall observations from sensor P_LUGANO between 2013-01-01T00:00:00+01 and 2013-02-4T17:00:00+01
http://localhost/istsos/demo?
    service=SOS&
    version=1.0.0&
    request=GetObservation&
    offering=temporary&
    procedure=urn:ogc:def:procedure:x-istsos:1.0:P_LUGANO&
    eventTime=2014-06-01T00:00:00+0200/2014-06-03T00:00:00+0200&
    observedProperty=urn:ogc:def:parameter:x-istsos:1.0:meteo:air:rainfall&
    responseFormat=text/xml;subtype=”sensorML/1.0.1”&
    service=SOS&
    version=1.0.0
Example 2 - filter on time, property
Requesting rainfall observations from all the stations between 2014-06-01T00:00:00+02 and 2014-06-03T00:00:00+02
http://localhost/istsos/demo?
    service=SOS&
    version=1.0.0&
    request=GetObservation&
    offering=temporary&
    eventTime=2014-06-01T00:00:00+0200/2014-06-03T00:00:00+0200&
    observedProperty=urn:ogc:def:parameter:x-istsos:1.0:meteo:air:rainfall&
    responseFormat=text/xml;subtype=”sensorML/1.0.1”&
    service=SOS&
    version=1.0.0
Example 3 - filter on time, property, area filters
Requesting rainfall observations from all the stations between 2014-06-01T00:00:00+02 and 2014-06-03T00:00:00+02
http://localhost/istsos/demo?
    service=SOS&
    version=1.0.0&
    request=GetObservation&
    offering=temporary&
    observedProperty=meteo&
    responseFormat=text/xml;subtype=”sensorML/1.0.1”&
    service=SOS&
    version=1.0.0&
    featureOfInterest=<ogc:BBOX>
        <ogc:PropertyName>the_geom</ogc:PropertyName>
        <gml:Box srsName='EPSG:4326'>
            <gml:coordinates>18,4530,55</gml:coordinates></gml:Box>
        </ogc:BBOX>
Example 4 - filter on time, property, distance filters
Requesting rainfall observations from all the stations between 2014-06-01T00:00:00+02 and 2014-06-03T00:00:00+02
http://localhost/istsos/demo?
    service=SOS&
    version=1.0.0&
    request=GetObservation&
    offering=temporary&
    observedProperty=temperature&
    responseFormat=text/xml;subtype=”sensorML/1.0.1”&
    service=SOS&
    version=1.0.0&
    featureOfInterest=<ogc:DWithin>
        <ogc:PropertyName>SHAPE</ogc:PropertyName>
        <gml:Point srsName="EPSG:4326">
            <gml:coordinates decimal="." cs="," ts="">8.967,46.027</gml:coordinates>
        </gml:Point>
        <ogc:Distance>1</ogc:Distance>
    </ogc:DWithin>
Using the istSOS extending features
In this part of the tutorial we will explore the extending features of istSOS, developed for making users life easier and to fulfill data experts requirements.
Example 5 - GetObservation with simple names
According to the standard observedProperties and procedures are accessible using a Unique Resource Identifier (URI). This is those used when the observed property and the procedure was created. In this tutorial we used for example:
istSOS is not strict and allows to specify in a GetObservation request just the or procedure name and/or observed property in the request: as a result for the desired procedures all the observed properties with that words will be selected (LIKE „%XXX%‟ SQL query). In a suggested hierarchical usage of URIs, this allows to quickly access to all the subdomain properties, so for example using observedProperty=urn:ogc:def:parameter:x- istsos:1.0:meteo in a getObservation request in istSOS will return all the available observations which measure meteo parameters (rainfall, windspeed, humidity, etc..).
Let‟s try requesting all the rainfall observations between 2014-06-01T00:00:00+02 and 2014-06- 03T00:00:00+02:
http://localhost/istsos/demo?
    service=SOS&
    version=1.0.0&
    request=GetObservation&
    offering=temporary&
    eventTime=2014-06-01T00:00:00+0200/2014-06-03T00:00:00+0200&
    observedProperty=rainfall&
    responseFormat=text/xml;subtype=”sensorML/1.0.0”
And now the same, but only for LUGANO station:
http://localhost/istsos/demo?
    service=SOS&
    version=1.0.0&
    request=GetObservation&
    offering=temporary&
    procedure=P_LUGANO&
    eventTime=2014-06-01T00:00:00+0200/2014-06-03T00:00:00+0200&
    observedProperty=rainfall&
    responseFormat=text/xml;subtype=”sensorML/1.0.1”
Example 6 - GetObservation with specific time zone
istSOS support time zones. Whenever in getObservation request the eventTime is specified with a time zone (e.g.: +0700) the response will be returned with the same time zone.
http://localhost/istsos/demo?
    service=SOS&
    version=1.0.0&
    request=GetObservation&
    offering=temporary&
    procedure=P_LUGANO&
    eventTime=2014-06-01T00:00:00+0500/2014-06-03T00:00:00+0500&
    observedProperty=rainfall&
    responseFormat=text/xml;subtype=”sensorML/1.0.1”&
Example 7 - GetObservation in CSV or JSON
In addition to the mandatory text/xml;subtype=”sensorML/1.0.0” istSOS support also application/json and text/csv (for simplification also text or json )
Data in CSV:
http://localhost/istsos/demo?
    service=SOS&
    version=1.0.0&
    request=GetObservation&
    offering=temporary&
    eventTime=2014-06-01T00:00:00+0200/2014-06-03T00:00:00+0200&
    observedProperty=rainfall&
    responseFormat=text/plain
Data in JSON:
http://localhost/istsos/demo?
    service=SOS&
    version=1.0.0&
    request=GetObservation&
    offering=temporary&
    eventTime=2014-06-01T00:00:00+0200/2014-06-03T00:00:00+0200&
    observedProperty=rainfall&
    responseFormat=application/json
Example 8 - GetObservation with data aggregation on the fly
When executing a getObservation request istSOS offer an extra feature. Adding vendor specific parameters aggregateInterval, aggregateFunction, aggregatenodata* and **aggregatenodataqi* you can request data already aggregated by istSOS.
- aggregateInterval: ISO 8601 Durations (e.g.: P1DT = 1 Day, PT12H = 12 hours)
- aggregateFunction: AVG, SUM, MAX, MIN
The next two parameters are optional and the default values can be configured using the Web Admin interface:
- aggregatenodata: numeric value to use in the case of irregular time series.
- aggregatenodataqi: the quality index to be assigned to no data.
For example we can Request maximal daily temperature observation:
http://localhost/istsos/demo?
    service=SOS&
    version=1.0.0&
    request=GetObservation&
    offering=temporary&
    procedure=T_LUGANO&
    eventTime=2014-05-04T00:00:00+01/2014-05-14T00:00:00+01&
    observedProperty=temperature&
    aggregateInterval=PT24H&
    aggregateFunction=MAX&
    responseFormat=text/plain
Using the WA REST
Composing a WA REST request is all about building the correct path url.
GetObservation with WA REST
To get the observations execute this request:
Note
- Executing a service request, you will receive a list of istSOS service instances: http://localhost/istsos/wa/istsos/services
- Executing a procedures get list operation, you will receive a list of procedures belonging to a specific service: http://localhost/istsos/wa/istsos/services/demo/procedures/operations/getlist
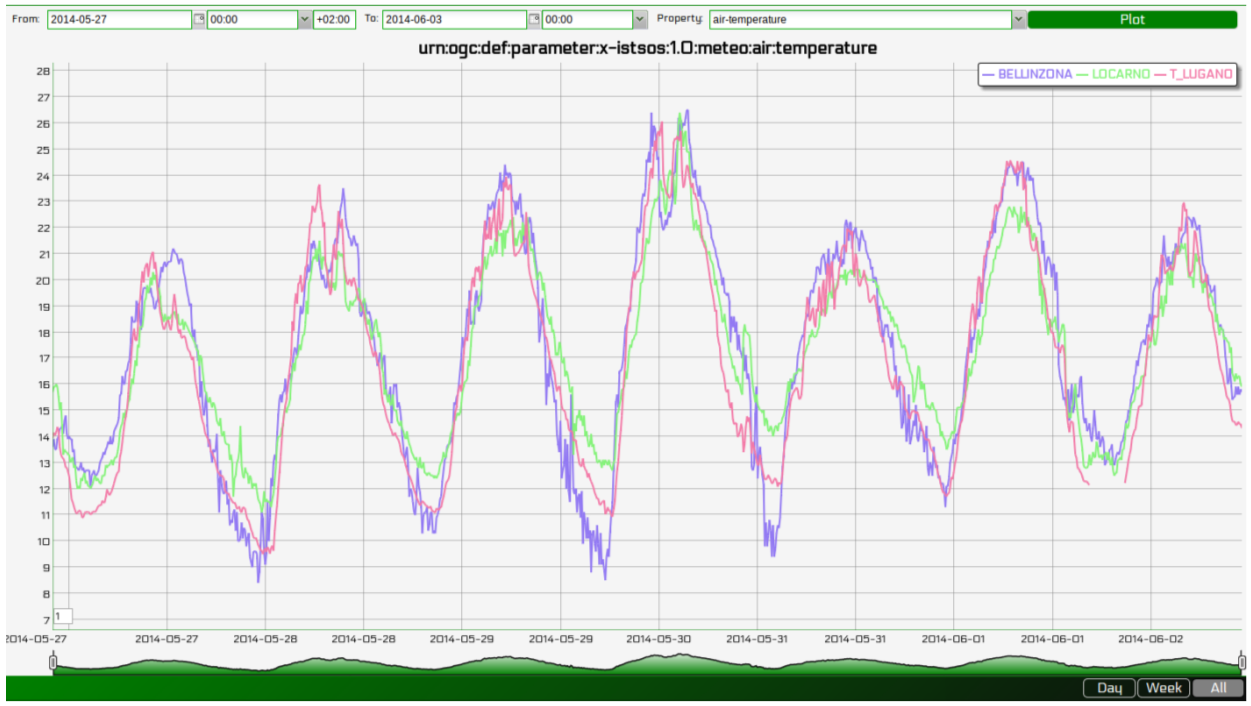
Using the Data Viewer
The istSOS web administration pages interact with the service making use of WA REST. The Data Viewer panel is implemented as an example of data visualization.
View observation
To open your Web Viewer follow this link: http://localhost/istsos/admin/viewer.html
Note
Up to now the viewer permit to display data of a single observationProperties only, you can select and display multiple procedures but with the same observed property.
Go ahead and take some confidence with the Data Viewer.
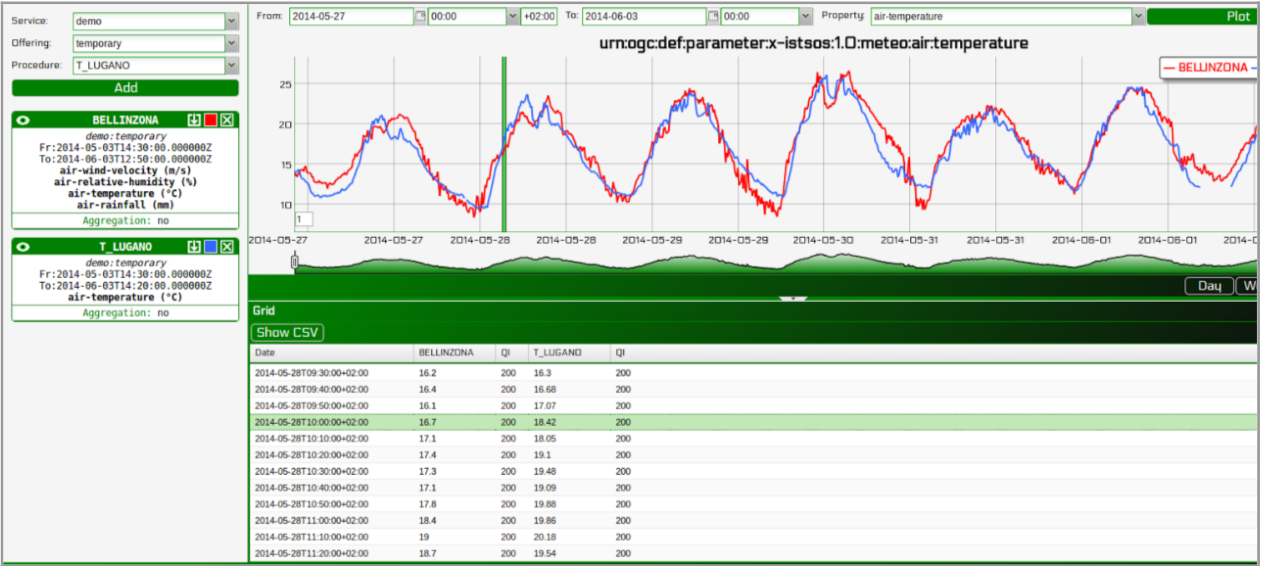
From the Web Admin:
Go to Data Viewer
Press the Data Editor button
- Like in the Data Viewer sequentially choose
- the service demo,
- the offering temporary
- and then “Add” BELLINZONA, LOCARNO and T_LUGANO
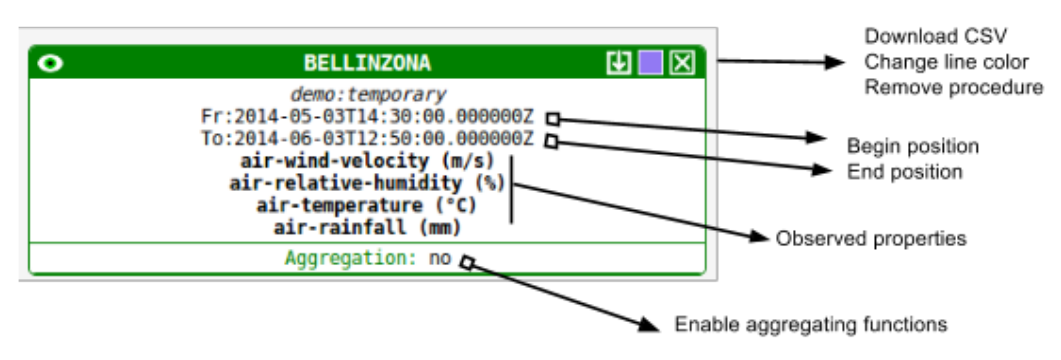
And:
- On the right panel choose the Property: air-temperature
- Press “Plot”, the last week of measurements is loaded and displayed
